VolterraVolterra
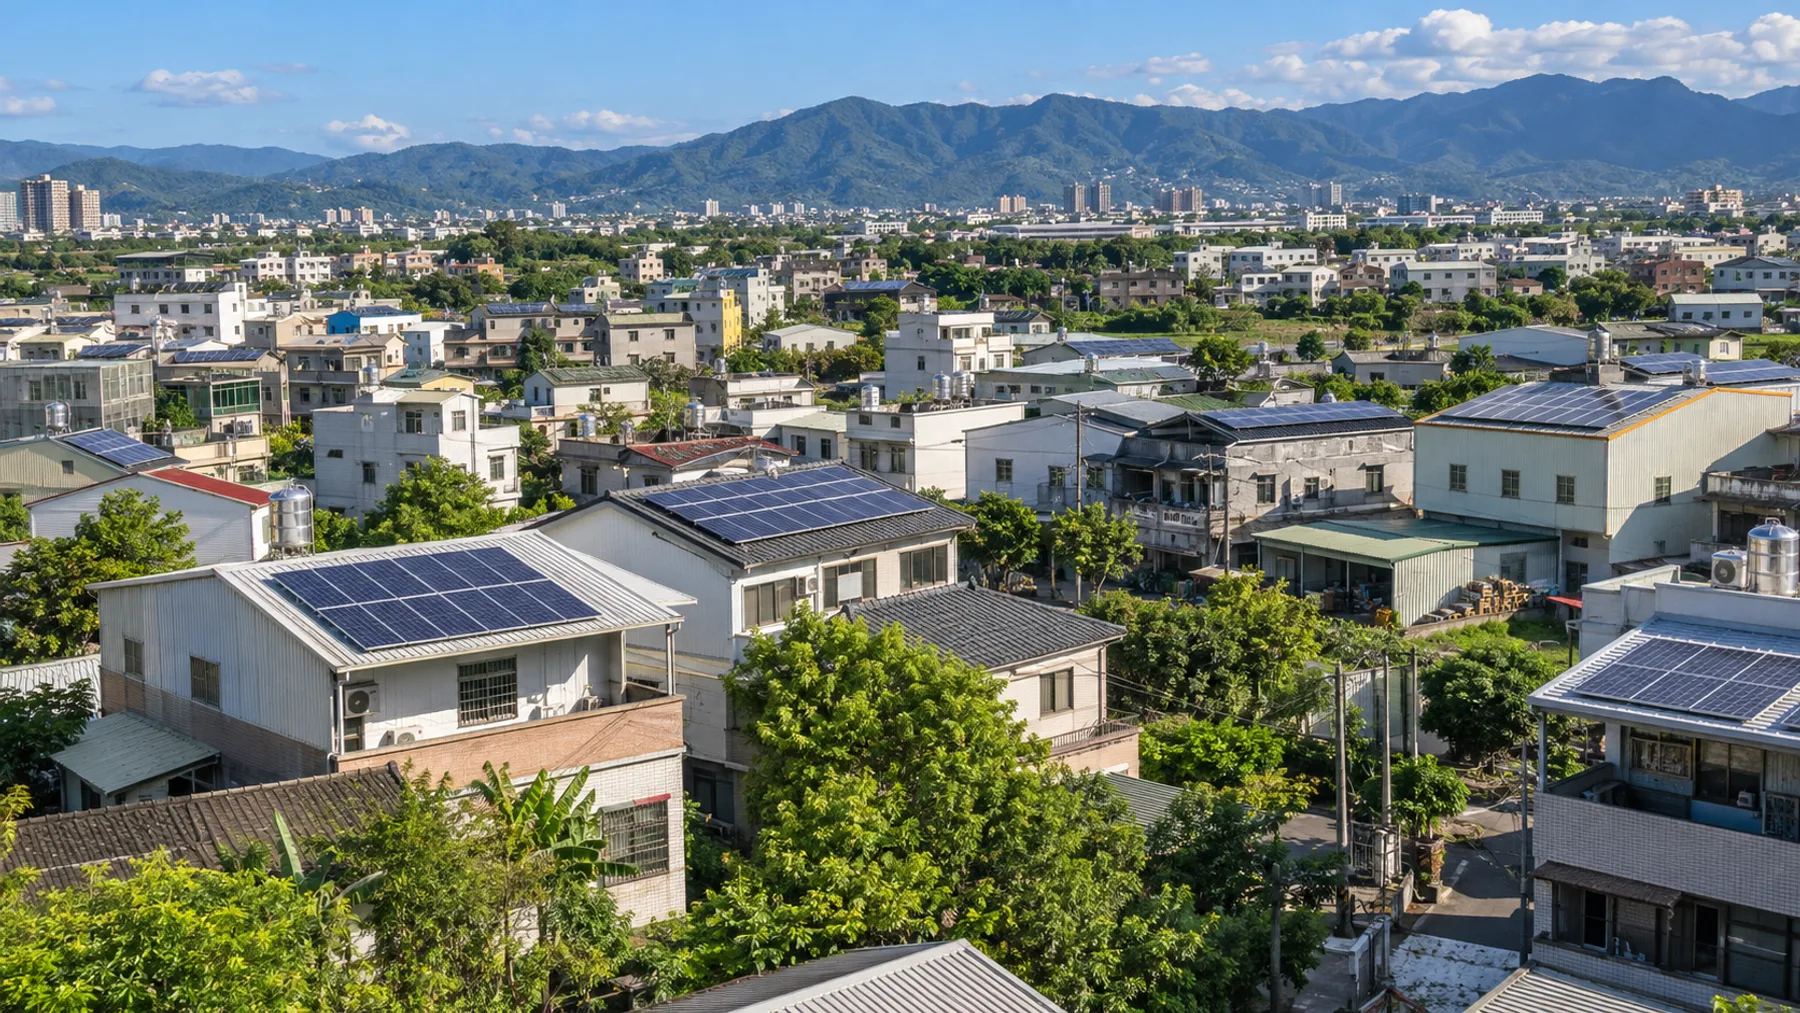
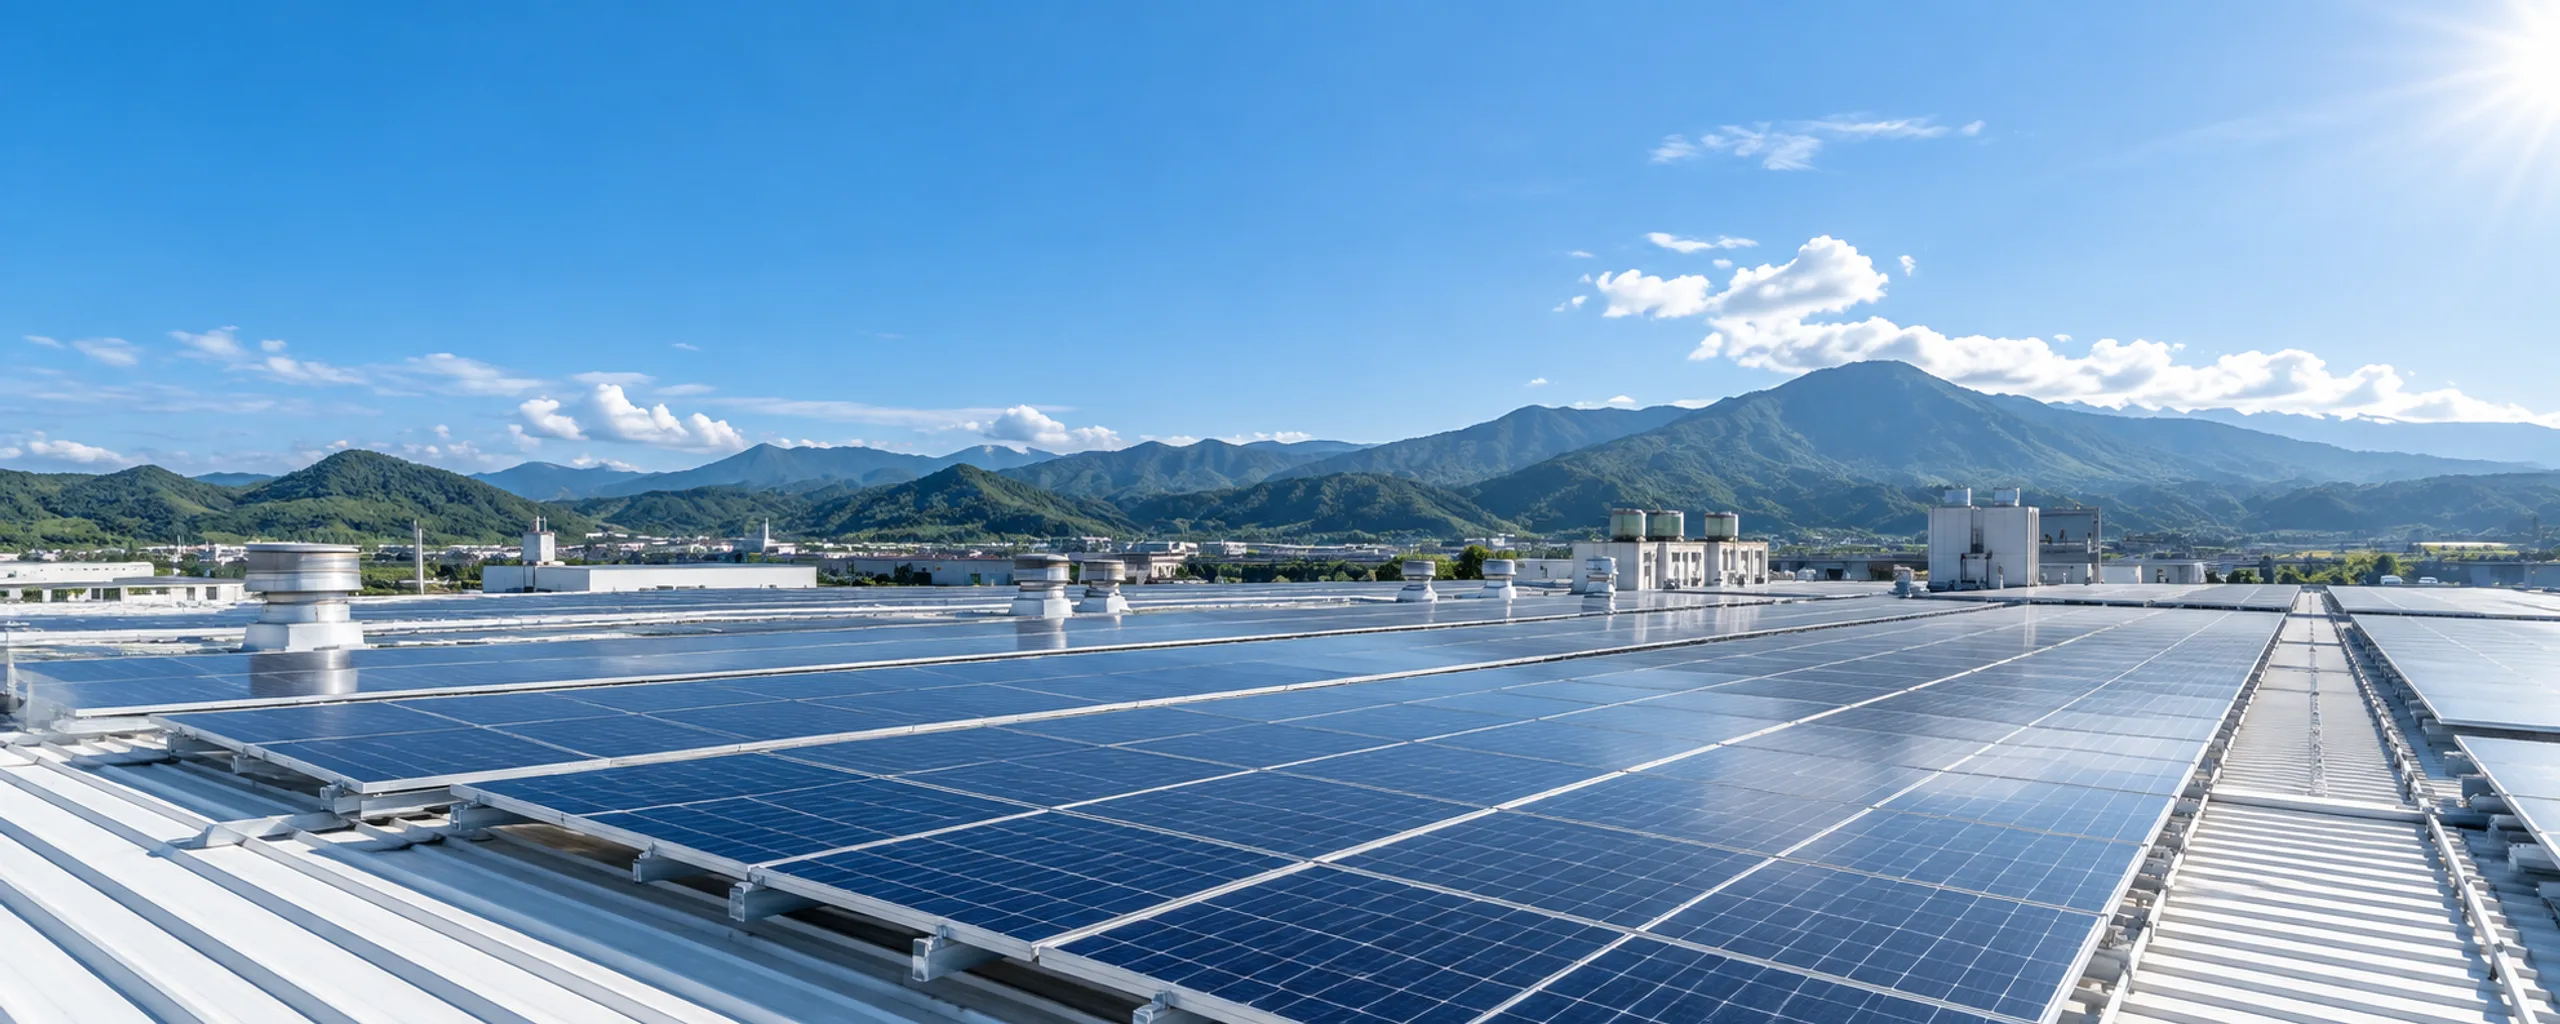
Solar panels across a Taiwanese factory roof under a clear morning sky

Store daytime energy
for the evening peak

Connect rooftop solar, storage and operating schedules. Start with a day of demand, then decide where the energy goes.

Reduce peak costs · Use more renewable power · Reserve backup energy

Explore the daily plan
Generate by dayUse at peak
06:0012:0018:00
An illustrative daily energy plan

06:00 Before the working day

Understand demand across the day

Generation and demand do not always coincide. Read production schedules, rooftop output and contracted capacity together to plan what to store at noon and release later.

All operating figures below are illustrative, not reported results.

Managed capacity2.4GWh
Connected sites186sites
Average peak reduction31%
Cumulative avoided emissions84K tCO₂e

10:00 From generation to consumption

Four solutions across one day

These time windows explain use cases, not tariff periods. Charging, discharge and grid participation depend on each site and its operating rules.

00:00–24:00 Illustrative operating window
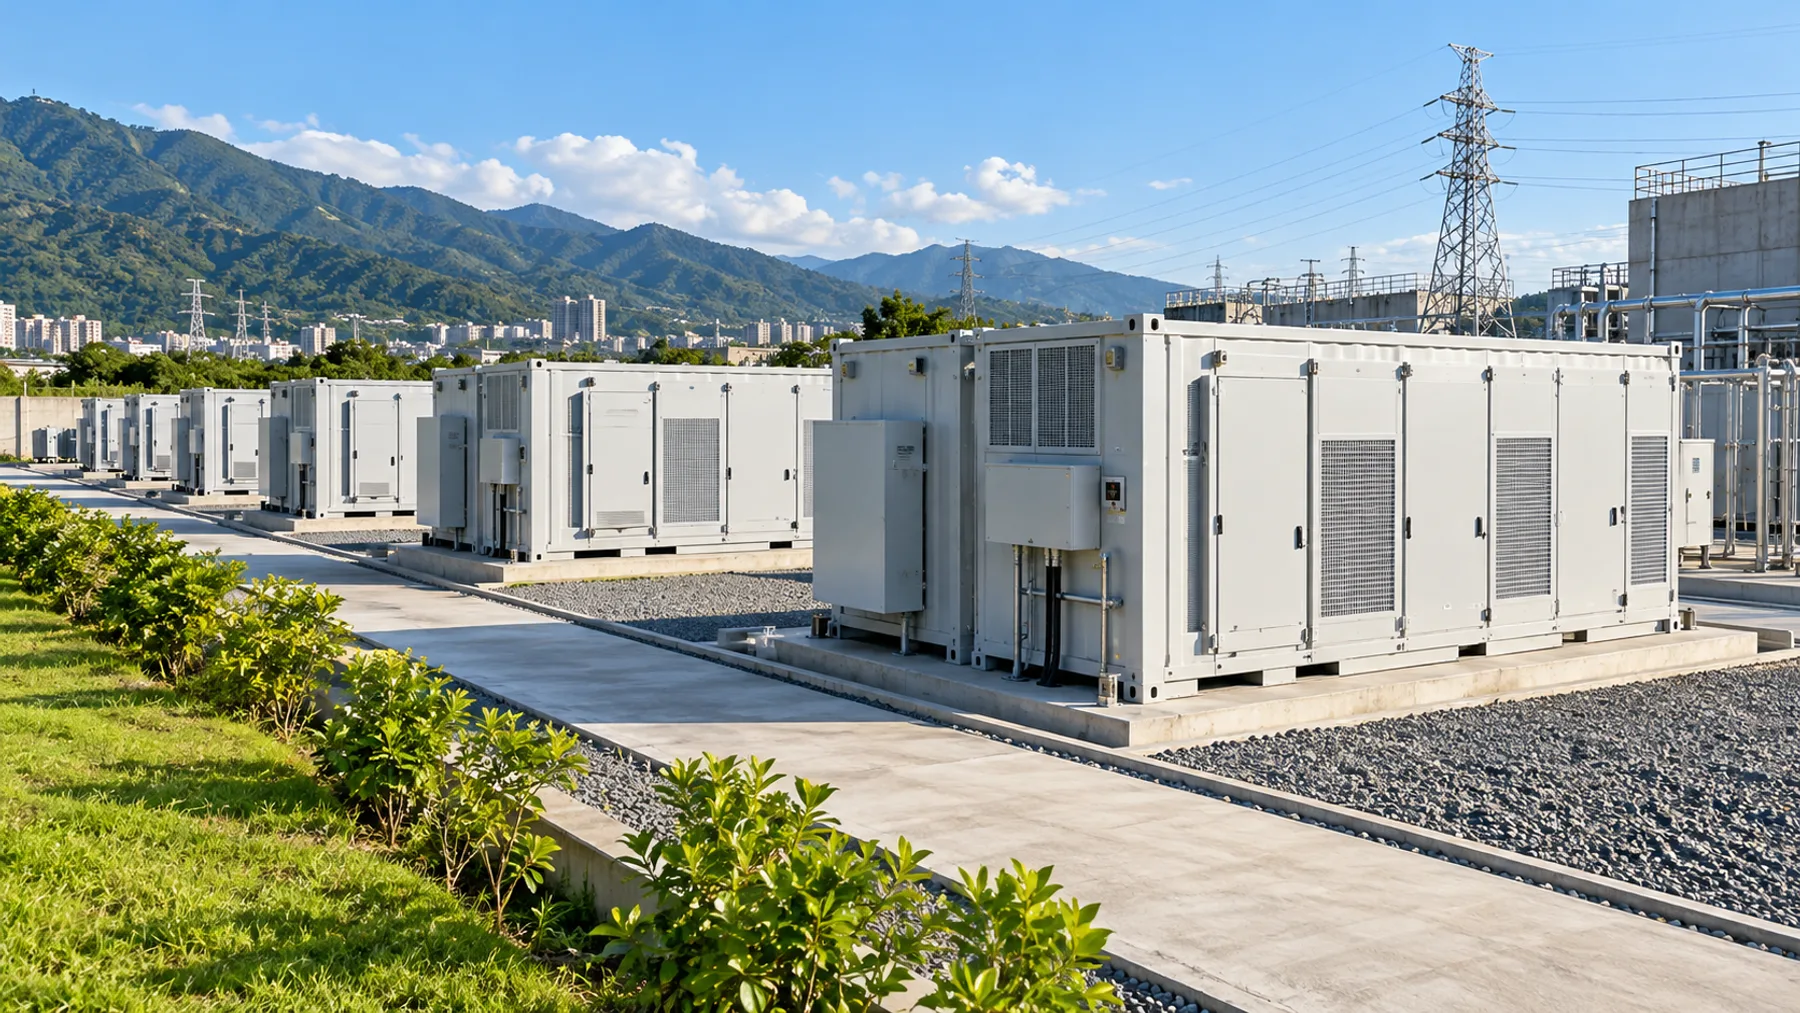
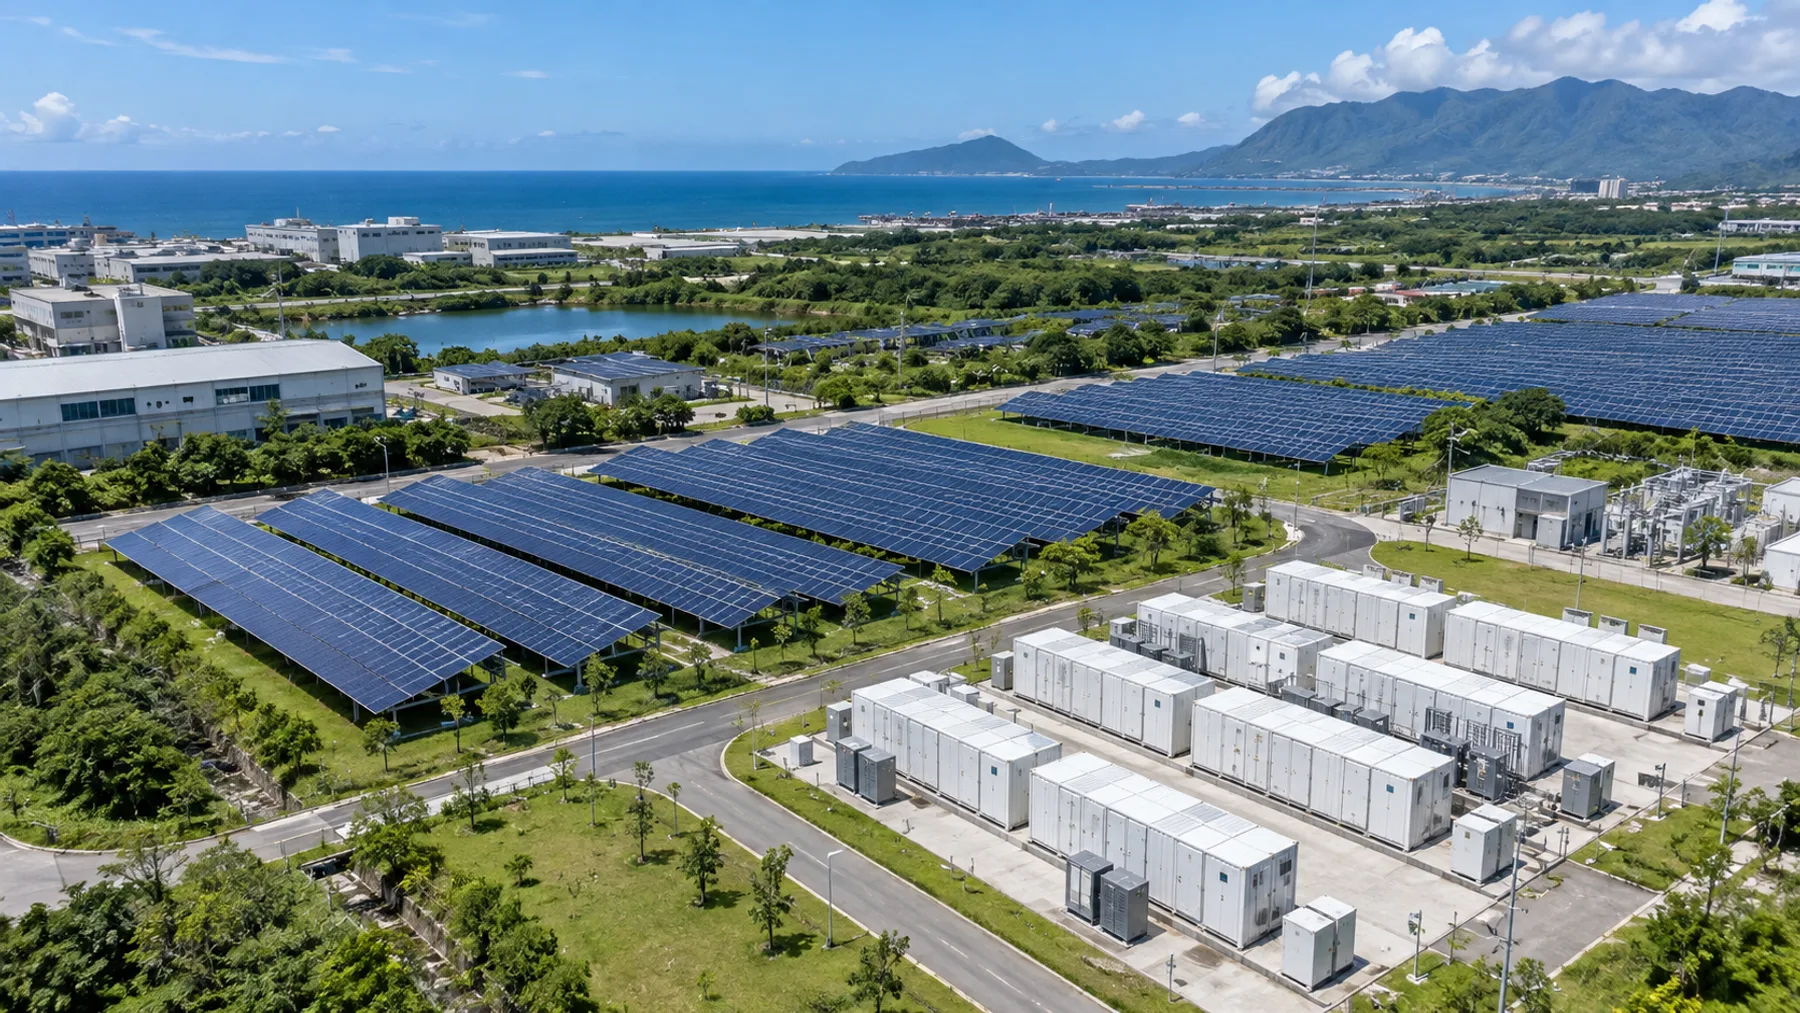
Rows of utility-scale battery containers

Utility-scale storage

Keep capacity available throughout the day for grid needs. Plan siting, storage capacity, grid connection and long-term maintenance for ancillary service participation.

Discuss grid storage
11:00–14:00 Illustrative operating window
Solar generation and storage on one site

Renewable integration

When midday generation exceeds site demand, coordinate solar, wind and batteries. Serve local loads first, then plan storage and export within equipment limits.

Review renewable supply
16:00–20:00 Illustrative operating window
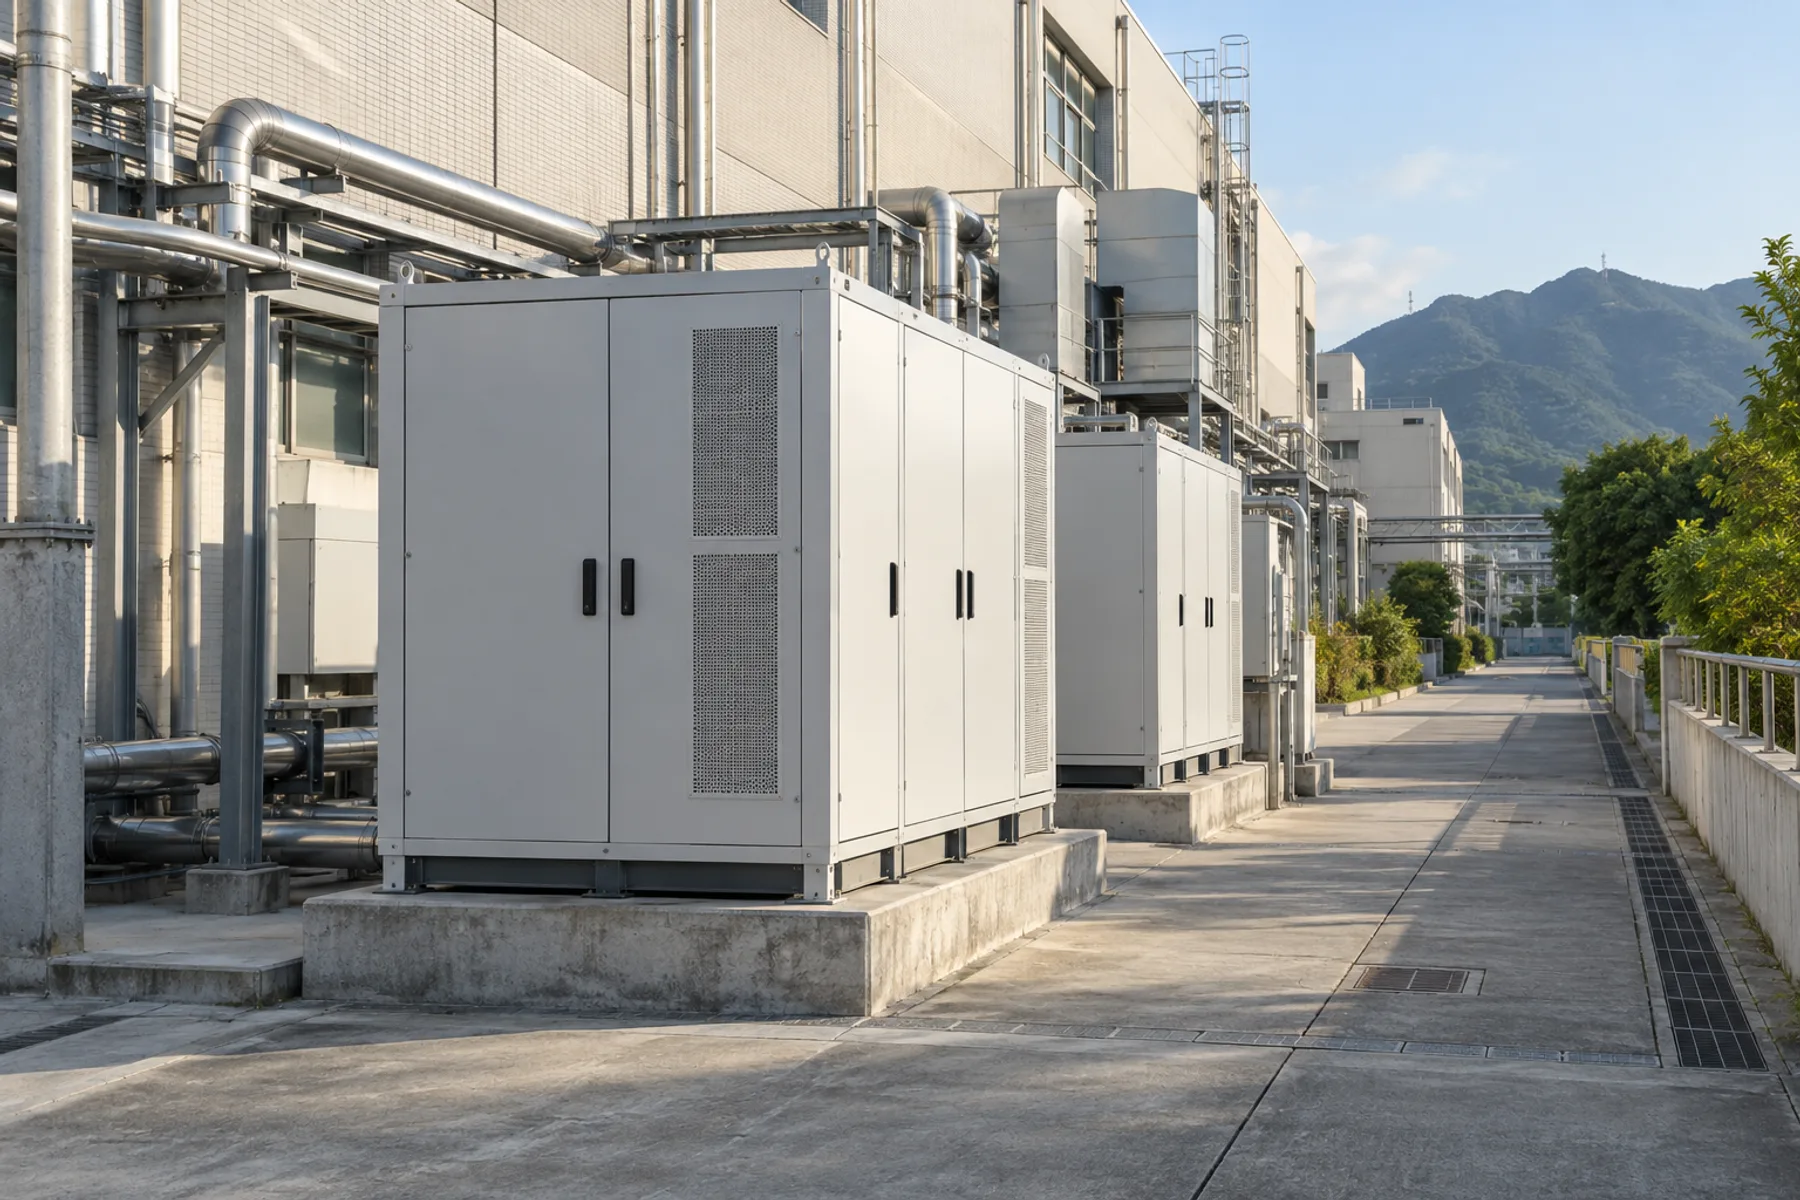
Commercial battery cabinets beside a factory

Commercial energy management

As demand rises later in the day, storage serves part of the load. Combine peak shaving, demand management and backup planning while reserving energy for critical equipment.

Explore demand planning
18:00–22:00 Illustrative operating window
Distributed solar rooftops across a community

Virtual power plant aggregation

Link available resources across rooftops, communities and factories. Coordinate the evening response around each site’s flexibility rather than treating every device as one battery.

Discuss aggregation

12:00 The next decision is 15 minutes away

Orbit plans the day in 96 intervals

Solar output, production demand and battery reserves keep changing. Every 15 minutes, Orbit forecasts, optimizes, dispatches and verifies to explain the next operating decision.

96intervals · 15 minutes each
Explore one interval
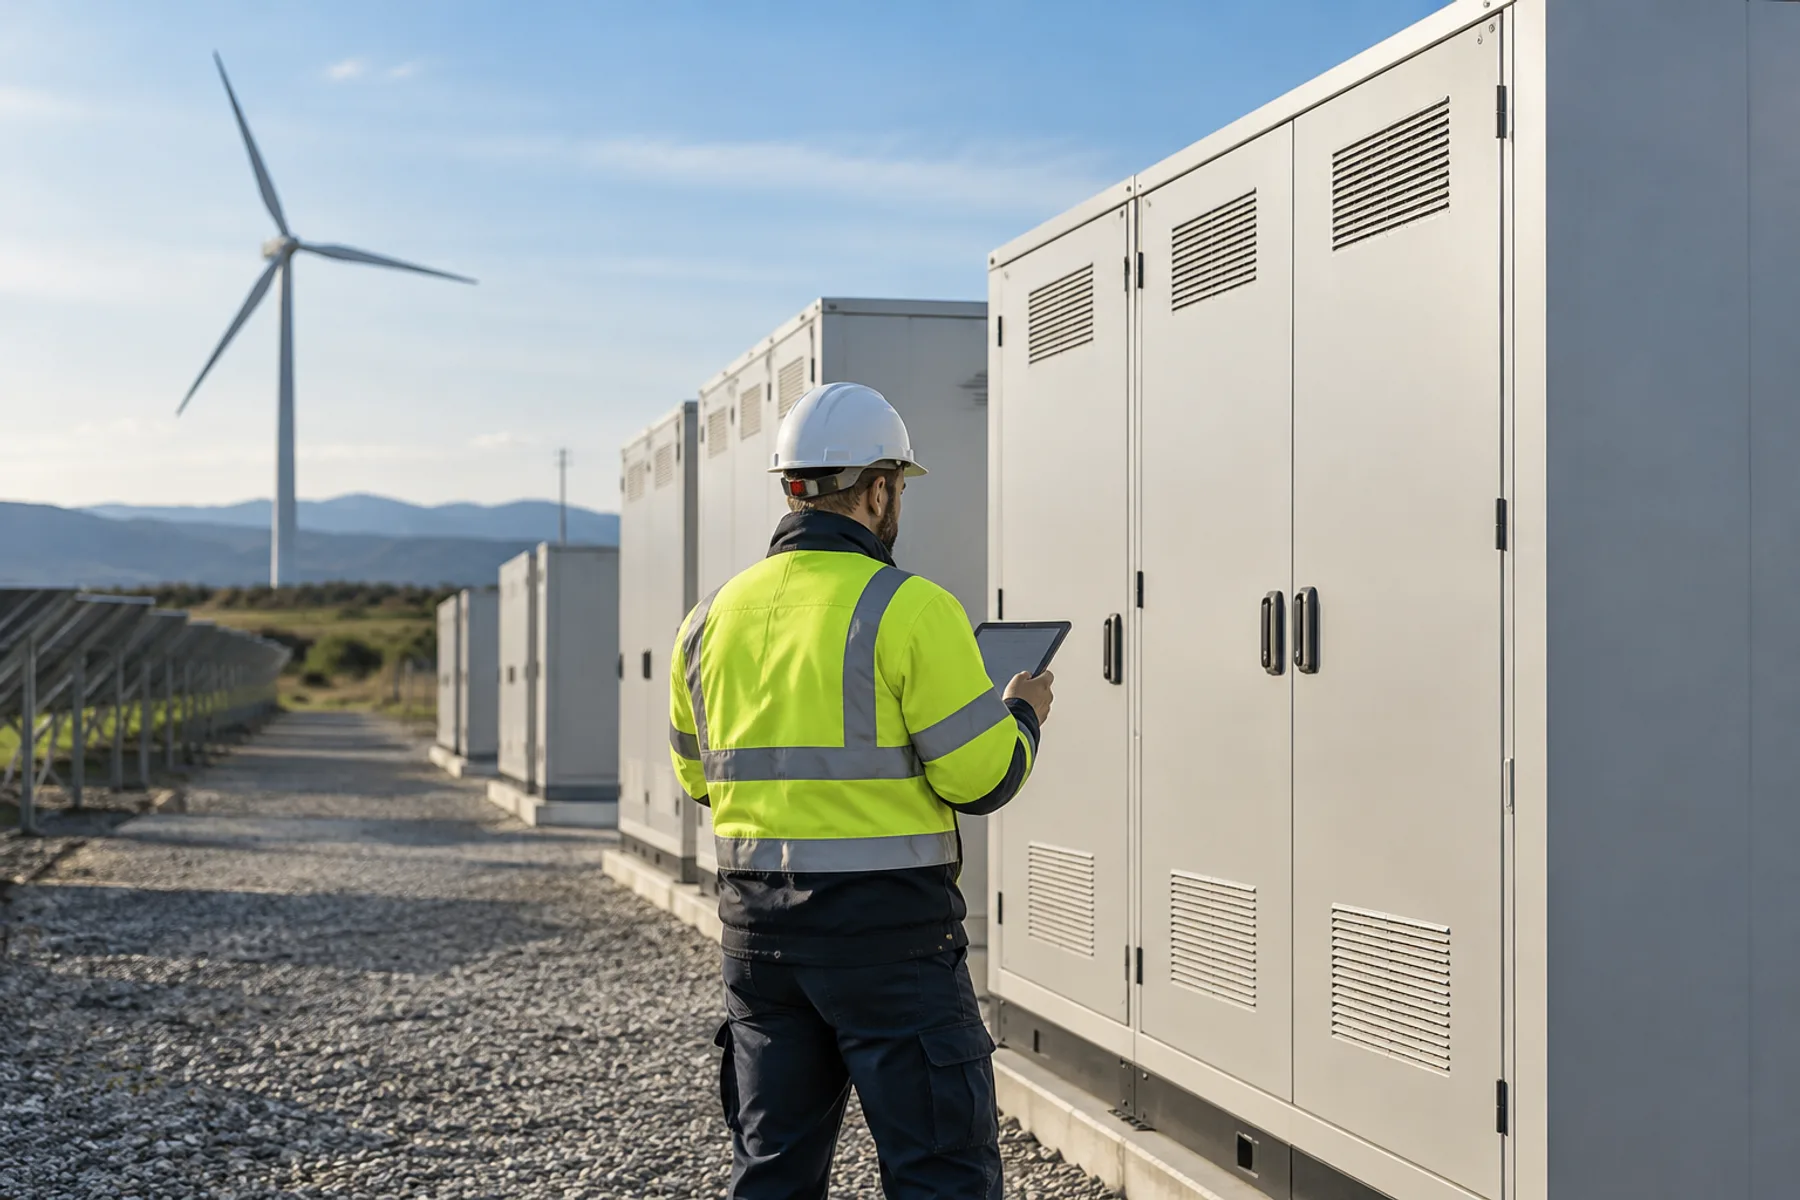
A maintenance engineer inspecting storage cabinets from behind

Choose a 15-minute interval

Use arrow keys to move, or Home and End to jump to either end.

ChargeDischargeStandbyExport
12:00–12:15Charge

Midday solar exceeds local demand. Supply the site first, then store the surplus.

This is an illustrative daily schedule with no connection to equipment, live tariffs or actual sites.

01

Forecast

Read near-term demand, weather and tariff conditions.

02

Optimize

Balance cost, emissions and the reserve required for backup.

03

Dispatch

Control storage and flexible loads within equipment limits.

04

Verify

Compare planned and actual consumption to refine the next cycle.

From the control room to the site

  • Real-time monitoring across sites
  • Demand and renewable generation forecasts
  • Fault alerts and maintenance dispatch
  • Performance and emissions reports

18:00 Use stored daytime energy at peak

Keep production running while storage shares the load

Illustrative project: 60 MWh of storage at a round-the-clock production site. Off-peak charging and peak discharge reduce demand while maintaining a reserve for critical loads.

A factory production line in continuous operation

Illustrative storage configuration

60MWh
First-stage benefits reached in
14 months
Critical load availability
99.9%
Review your own demand profile
Illustrative peak demand reduction
−29%

Relative demand · illustrative

Illustrative daily demand profiles with a 29 percent peak reduction
00:0006:0012:0018:0024:00

With storage dispatch, peak demand is 29% lower in this example.

Capacity, duration, availability and curves are illustrative. They are not customer results, tariff periods or guaranteed benefits. Actual design requires an assessment of loads, equipment and site conditions.

21:00 Review today and prepare tomorrow

Three questions to review your energy plan

A control room workstation with softly blurred monitoring screens

8 min read · sample article

How can storage planning move beyond capacity to revenue sources

Start with when assets are available, then consider the services they could support.

6 min read · sample article

Which three sources of flexibility should demand planning examine

Review shift schedules, movable loads and battery reserves together.

5 min read · sample article

Why should energy data inform operational decisions

Give alerts, maintenance teams and daily schedules a shared information source.

24:00 Start with a year of electricity data

Start your assessment with an electricity bill

Gather a year of load profiles and bills. Identify when peaks occur before discussing storage capacity, schedules and backup needs.

The form below demonstrates demand scenarios only. Your entries are neither submitted nor saved.

Explore your demand data

Illustrative assessment

Assume a 10% to 20% reduction in maximum demand

90–180 kW

Enter your data to see the contract utilization ratio and average load.

With solar installed, generation profiles are still needed to establish the available charging energy.

The 10% and 20% values are demonstration assumptions, not achievable benefits derived from your data. Tariffs, system capacity, efficiency and backup constraints are excluded. This is not a savings estimate, payback calculation or engineering recommendation.

What a full assessment needs

  • 12 months of bills and 15-minute demand data
  • Shift schedules, flexible loads and backup requirements
  • Rooftop generation profiles and site conditions

Illustrative contact

[email protected]

Taipei / Kaohsiung · illustrative locations

Sample article summary

How can storage planning move beyond capacity to revenue sources

Start with when assets are available, then consider the services they could support.

This content illustrates a fictional brand’s editorial layout. It is not published research or investment advice.

Discuss your demand profile
中文